
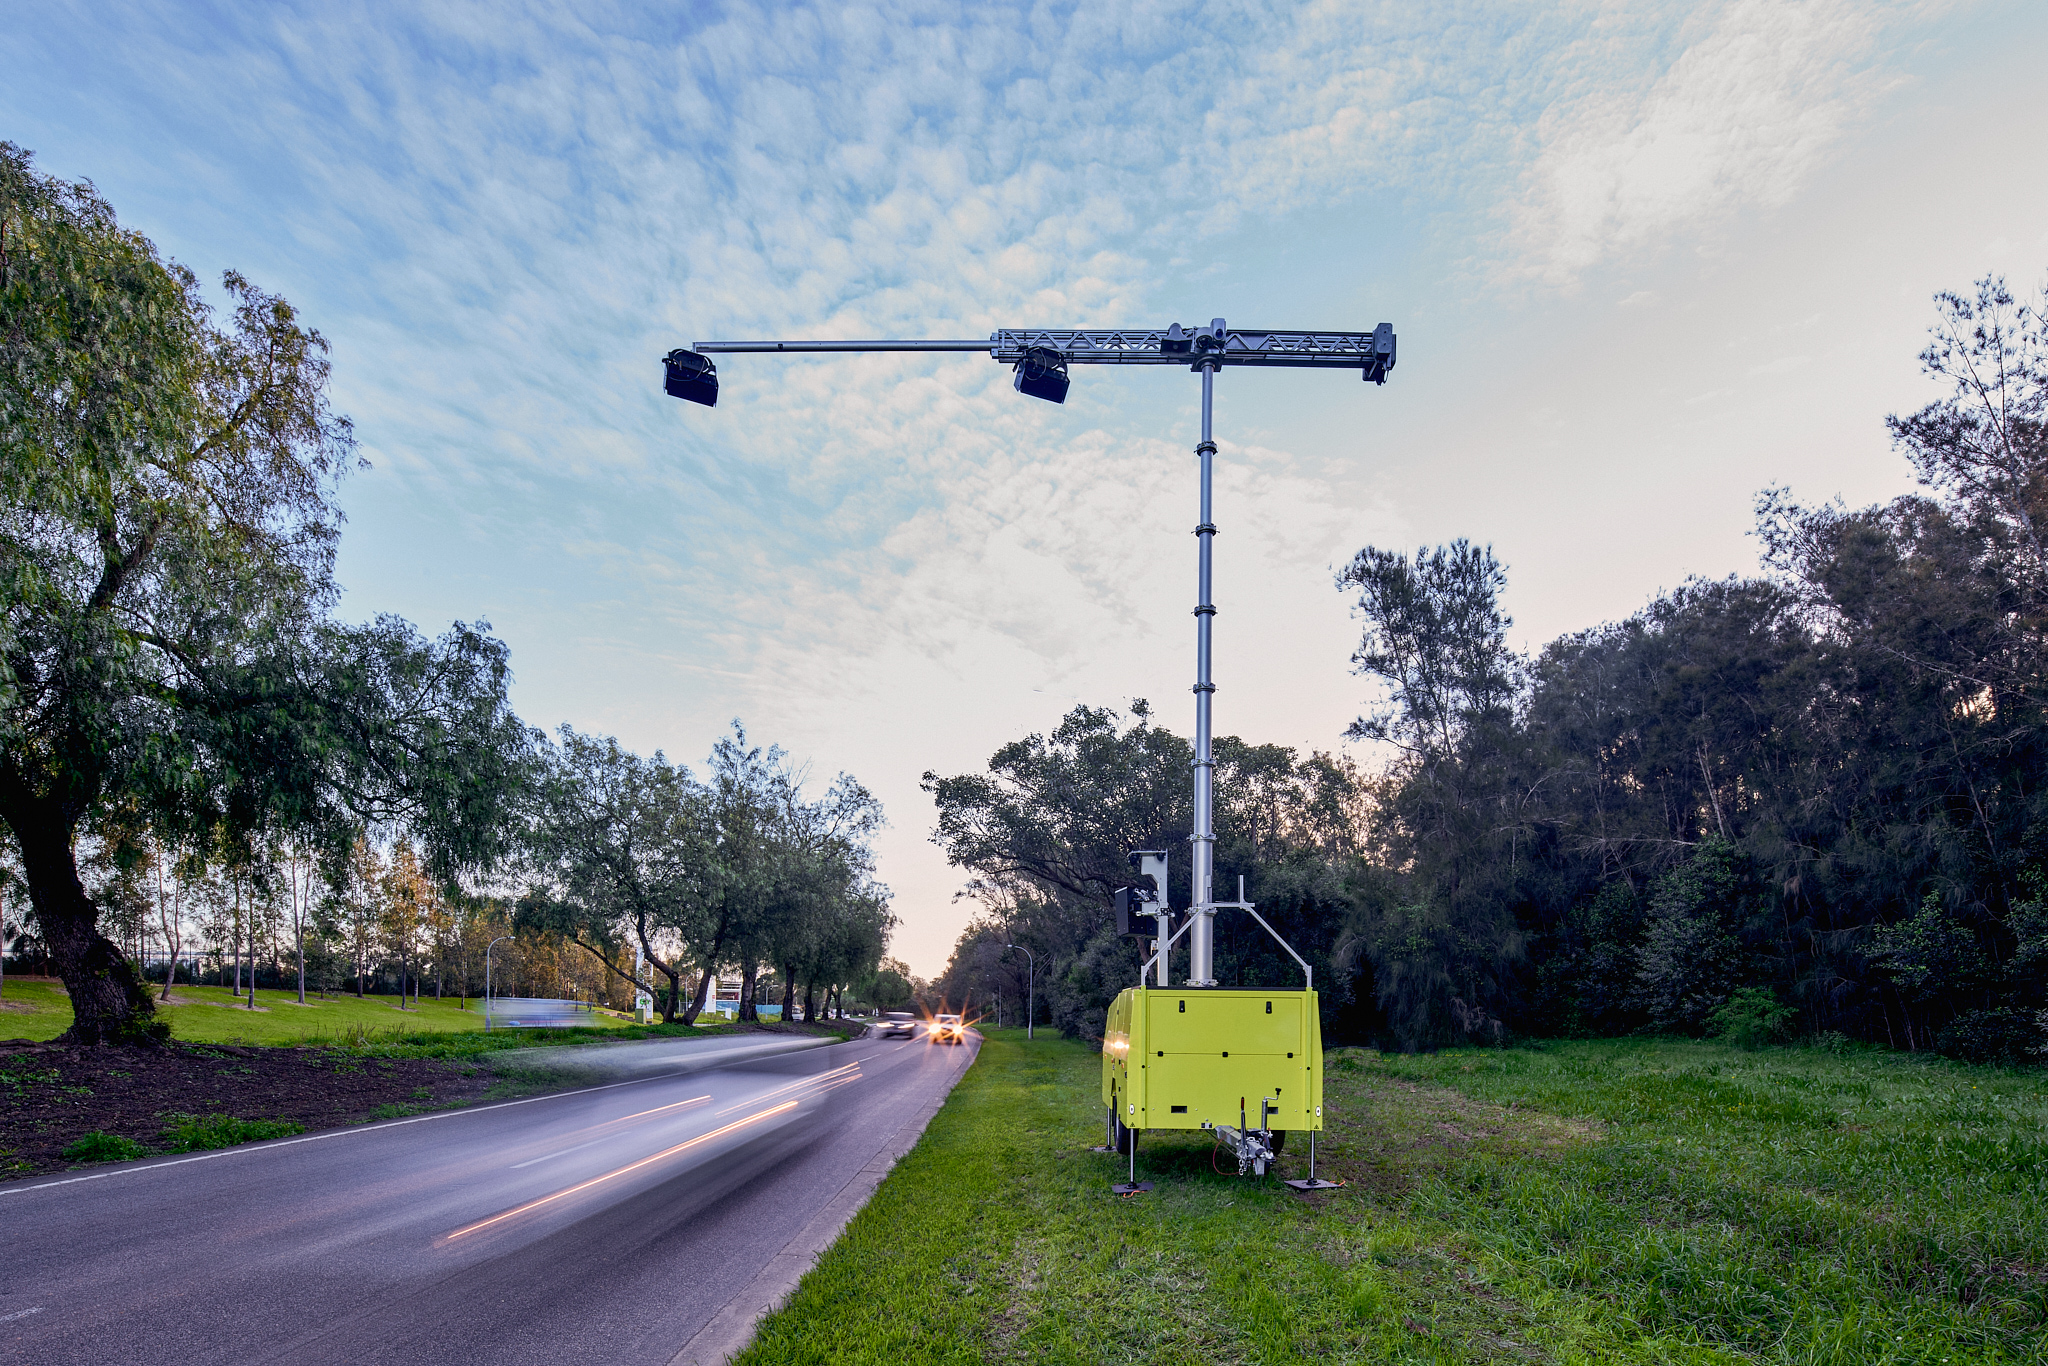
You drive beneath a camera. Infrared light illuminates the inside of your car and a high resolution image is captured through your windscreen. Software locates the driver, isolates a region around them and calculates whether what it sees warrants further attention. Your hand might be resting near your lap, your passenger might be holding a phone, or a dark rectangle might be visible against your clothing. The machine assigns a score. If that score is high enough, a human may see the image, and it may eventually become evidence.
This is already happening. In Sussex, between 13 April and 10 May 2026, road safety cameras using AI recorded 2,294 potential offences during four weeks of deployment on the A283: 459 offences involving mobile phones, 1,823 seatbelt offences and 12 cases of a driver not being in proper control. Sussex Police says artificial intelligence first identifies potential offences, after which police officers review the images.[1]
The technology comes from Australian road safety company Acusensus, whose Heads Up system is used across multiple UK police deployments. Acusensus says its UK system is configured specifically to identify illegal use of handheld mobile phones and failure to wear a seatbelt. Its AI examines captured images and assigns a confidence score. Flagged images enter human review, followed by a second independent human review before a potential violation is progressed.[2]
That human layer matters, but it leaves a deeper question: how trustworthy is the machine that decides which drivers humans should inspect in the first place? We set out to investigate that question without attacking the production system or obtaining proprietary weights or confidential data. We reconstructed the computational pipeline described in Acusensus's public patents and technical material, trained it on open research datasets and deliberately changed the conditions under which it had learned to operate. The results offer a lesson about how governments should evaluate AI before placing it inside an enforcement chain.
This is not ordinary CCTV
The first misconception is that these systems simply point a camera at traffic and ask an AI model whether someone is holding a phone. In practice, the physical system does much of the work before the neural network ever sees an image.
Infrared (IR) is light beyond the red end of the visible spectrum. Acusensus uses an infrared flash to illuminate the vehicle so its cameras can photograph the cabin through the windscreen. The cameras record reflected illumination, rather than creating a thermal image of body heat. Infrared illumination is therefore part of the image capture process that supplies the AI with a view of the driver.[13][3][4]
Acusensus describes its system as using multiple cameras, specialised lenses and filters, and sensors capable of capturing vehicles travelling at up to 300 km/h without motion blur. Its public patents describe photography triggered by radar, shutters that expose the whole image at once, and very short exposure times. This combination controls illumination and limits blur before the model makes a judgement.[3][4]
Machine learning becomes much easier when the image capture system removes some of the variation in the world. Instead of asking a model to understand arbitrary drivers under arbitrary lighting and viewpoints, the system narrows the problem to a known road position, controlled illumination, a sharp cabin image, locating the driver and analysing a crop around them.
Acusensus’s public patent family describes object detection to locate a steering wheel or person, identify the driver rather than a passenger, create a standardised crop around the driver, and classify that crop. YOLO and networks from the VGG family are given as examples.[4]
YOLO stands for You Only Look Once. It is an approach to object detection, finding objects in an image and drawing boxes around them. In our reconstruction, a detector from the YOLO family locates the person or driver region so the next model can examine that part of the image.[9]
VGG16 is an image classification neural network developed by Oxford’s Visual Geometry Group. It learns visual patterns and uses them to assign an image to a category. The ‘16’ refers to its 16 layers with learned weights. We adapted it through additional training to score the driver crop for phone use.[10]
These public documents do not prove that the company’s current production model uses VGG16 or any particular version of YOLO. Patents can describe designs long after production software evolves, but they give us a publicly disclosed computational skeleton that we could reconstruct and investigate.
We built the boring version
Our reconstruction deliberately avoided building the most fashionable vision system we could, because that would have answered the wrong question. We used a detector from the YOLO family to locate the person or driver region, expanded the detected crop, converted it to monochrome and reproduced the image normalisation described in the patent. We then fine tuned a VGG16 classifier pretrained on ImageNet to distinguish imagery showing phone use from imagery without it. The public training corpus contained 38,327 driver images across multiple people and distraction classes. The initial detector found a person in all 38,327 images.
We measured the model's ranking performance using two metrics. AUROC stands for area under the receiver operating characteristic curve. It measures how well the model ranks images showing phone use above images without phone use. A value of 0.5 represents ranking at chance level, while 1.0 means perfect separation. An AUROC of 0.976 means a randomly chosen image showing phone use ranks above a randomly chosen image without it about 97.6% of the time, with tied scores given half credit. Turning that ranking into referrals still requires a decision threshold.[11]
AUPRC stands for area under the precision recall curve. Precision asks how many of the images flagged for phone use actually show it. Recall asks how many of all the images showing phone use the model catches. AUPRC summarises the balance between those measures as the referral threshold changes. A higher value summarises a better balance between catching examples of phone use and keeping referrals correct on the same test set. For random ranking, the reference precision baseline is the fraction of examples showing phone use in the test set. Comparisons between datasets need that context.[12]
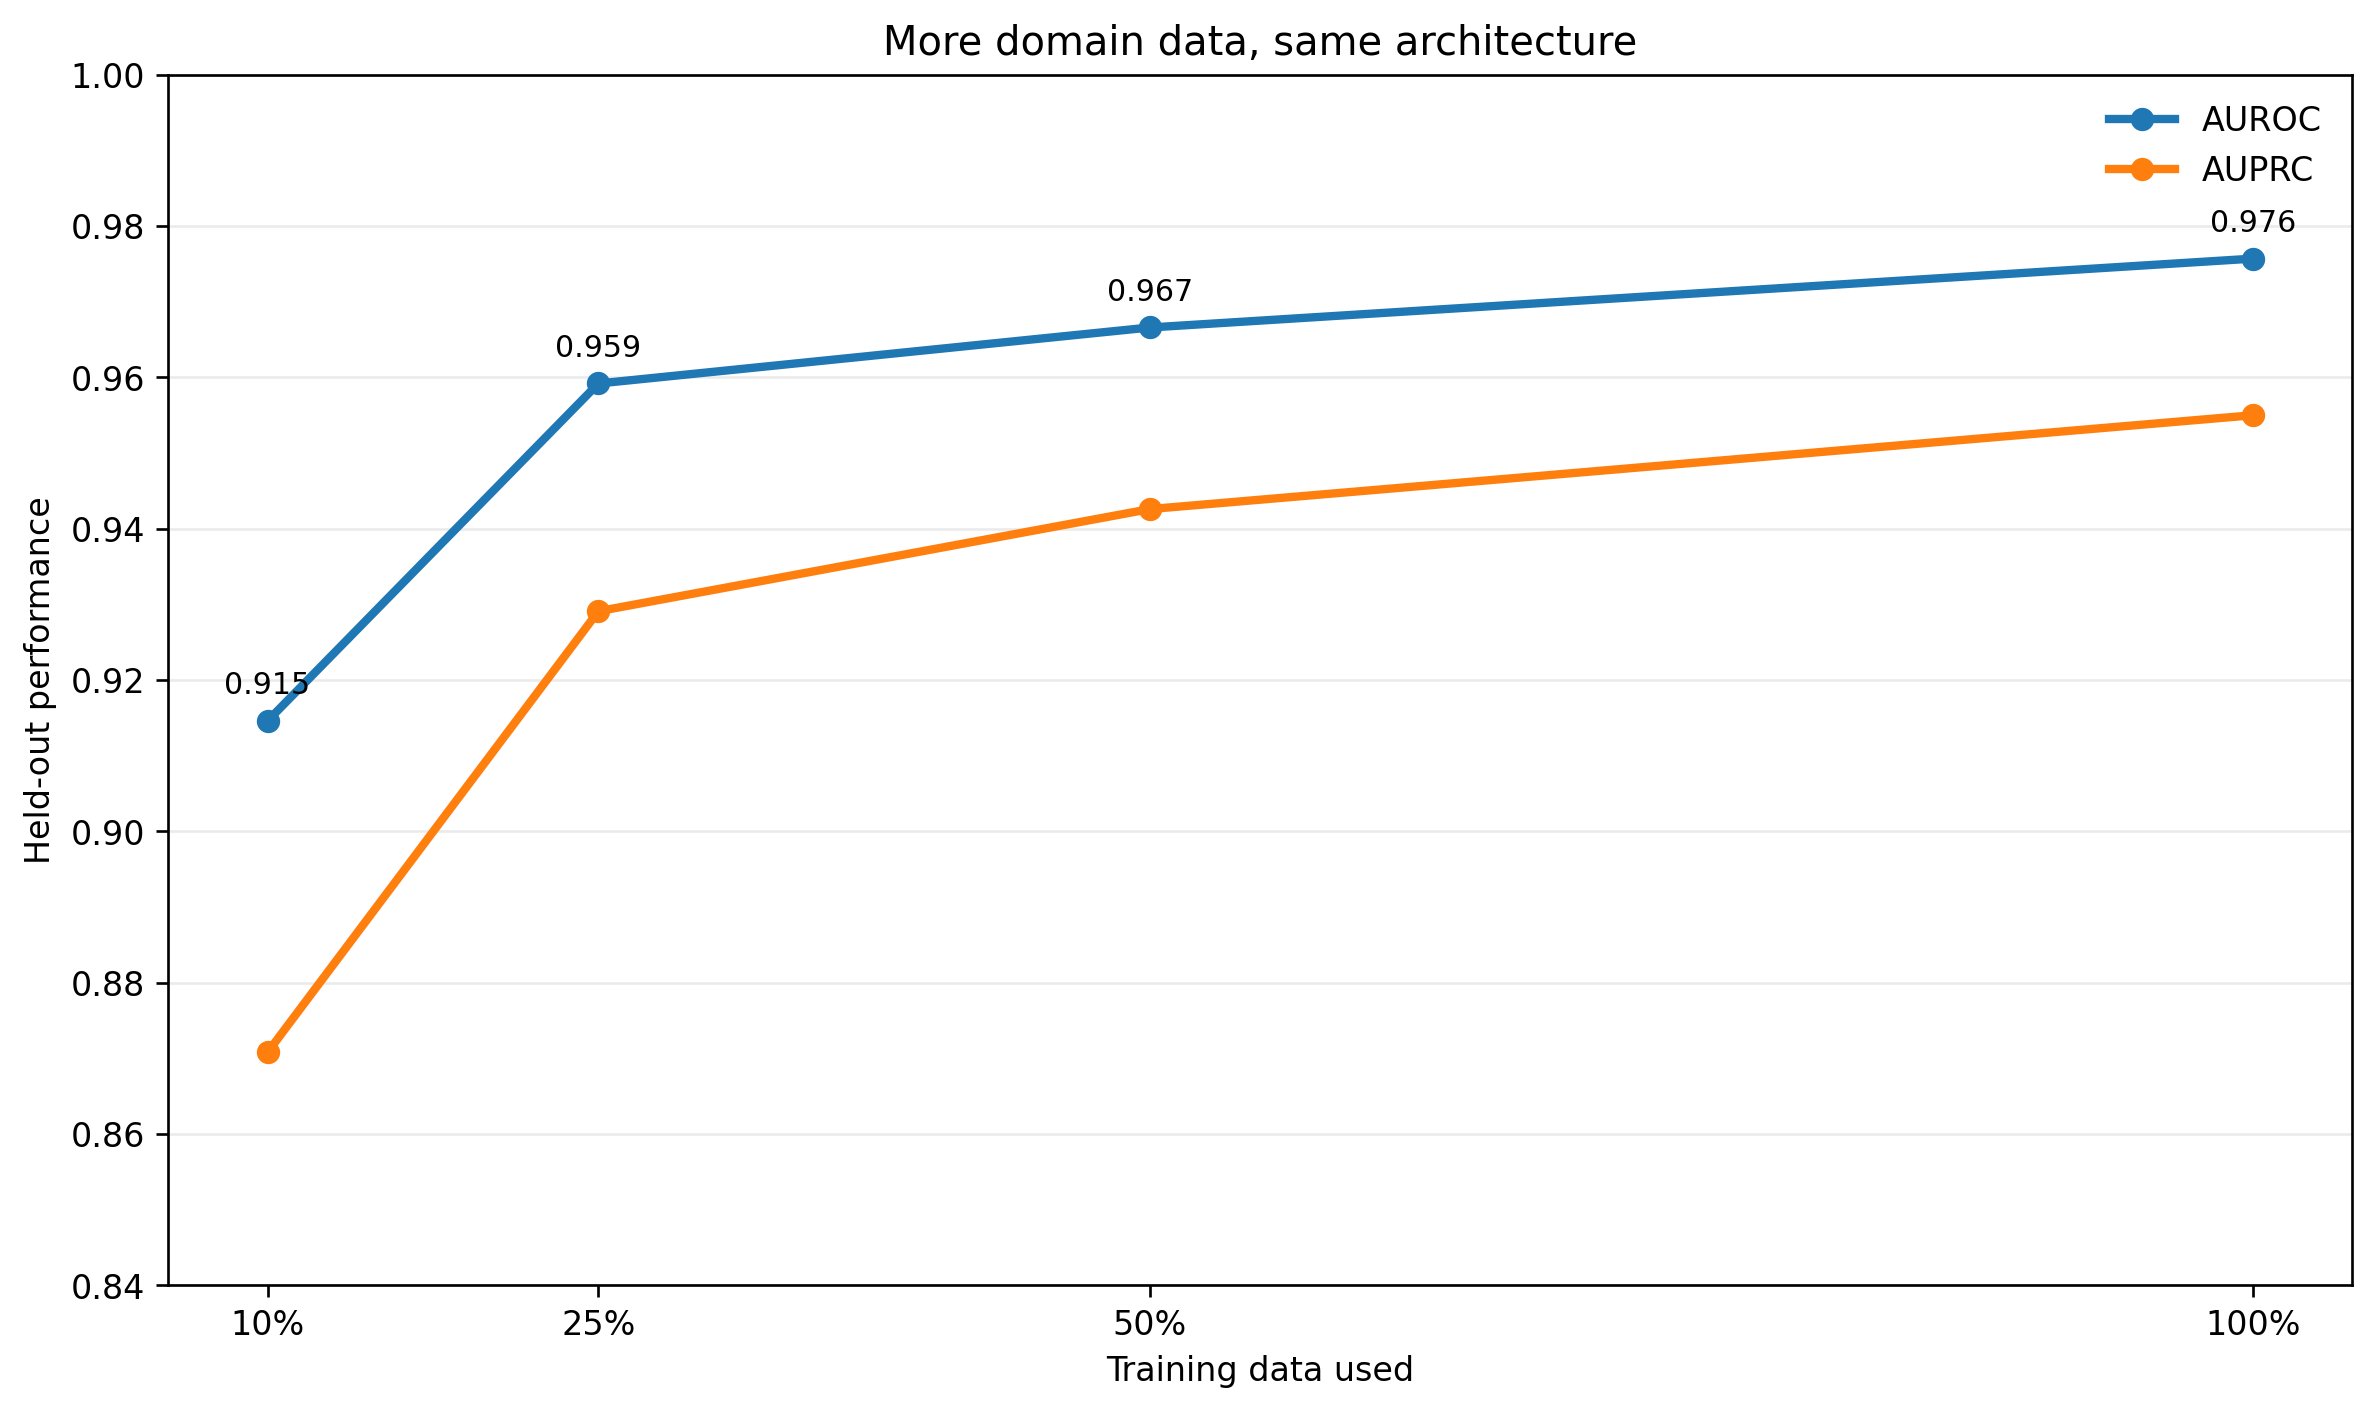
The conventional pipeline became extremely good. With only 10% of the available training data, the model achieved an AUROC of roughly 0.915. Increasing that to 25% brought it to 0.959, while 50% produced 0.967 and the full training set produced 0.976. The architecture and inference structure stayed the same throughout these comparisons. The amount of training data changed.
We then identified the training examples the model still found difficult and concentrated additional learning on them, a process known as hard example mining. Performance improved again: AUROC increased from approximately 0.9757 to 0.9785, while precision among the 10% of review candidates with the highest scores rose from 96.6% to 97.9%.
These are not measurements of Acusensus's proprietary model. They show that a relatively conventional neural architecture can become extremely effective when the world has been engineered into a narrow problem and the training data closely matches that problem. That matters when considering the company's competitive advantage. The useful question may be less about which secret neural network it has invented and more about how much data it has accumulated from the specific conditions of deployment, and what repeated human review allows it to learn from that data.
Then we changed the camera
Because a model can look excellent on familiar data, we made the experiment more revealing by moving it into a different visual domain.
NIR means near infrared, the part of the infrared spectrum closest to visible light. A camera sensitive to NIR can record reflected light that our eyes cannot see, and surfaces can look different at those wavelengths. Ordinary RGB images record red, green and blue visible light. Converting an RGB photograph to greyscale changes its appearance, but cannot recover information the camera never captured in the NIR spectrum.[13]
Drive&Act is an academic dataset for monitoring driver behaviour, recorded in a static driving simulator. It includes genuine NIR imagery captured by cameras sensitive to that light.[5]
We constructed a benchmark of 3,127 distinct behavioural events across 15 participants, including 125 events involving phone use. Participants were kept separate so that test drivers had never appeared during adaptation. The driver localisation stage still worked, finding the person in approximately 99.9% of the NIR frames, but the classifier’s performance collapsed.
In the evaluation on participants held out from adaptation, the system trained on RGB imagery achieved only around 0.545 AUROC and 0.045 AUPRC on genuine NIR. The pipeline still knew where the driver was, but had largely lost the ability to recognise what the driver was doing.
A claim such as “our AI is 99% accurate” needs the conditions attached to it, including wavelength, camera, vehicle population, lighting, image preparation, country and model version. A model’s performance belongs to a distribution of conditions, and changing those conditions can make an impressive benchmark number disappear.
Could fake infrared solve the problem?
We also asked whether genuine sensor data was necessary, or whether ordinary RGB imagery could be made to resemble infrared. Drive&Act contains synchronised RGB and infrared video, allowing the same behavioural events to be matched across both sensors.[5]
We took exactly the same events and transformed their RGB counterparts to resemble NIR imagery, using monochrome conversion, local contrast enhancement and a mild tonal transformation. No actual NIR information was used to construct this proxy. We then fine tuned the same model on the synthetic images and evaluated it on real NIR.
After training on the synthetic images, mean AUROC across our three participant folds rose from about 0.545 to 0.623. Repeating the process with genuine NIR training images raised it further, from about 0.545 to 0.662. The model trained on real NIR beat the synthetic version in all three outer test folds. Genuine adaptation also produced a statistically clearer improvement on AUPRC over the synthetic proxy, although its additional AUROC advantage was not decisive at the participant level.
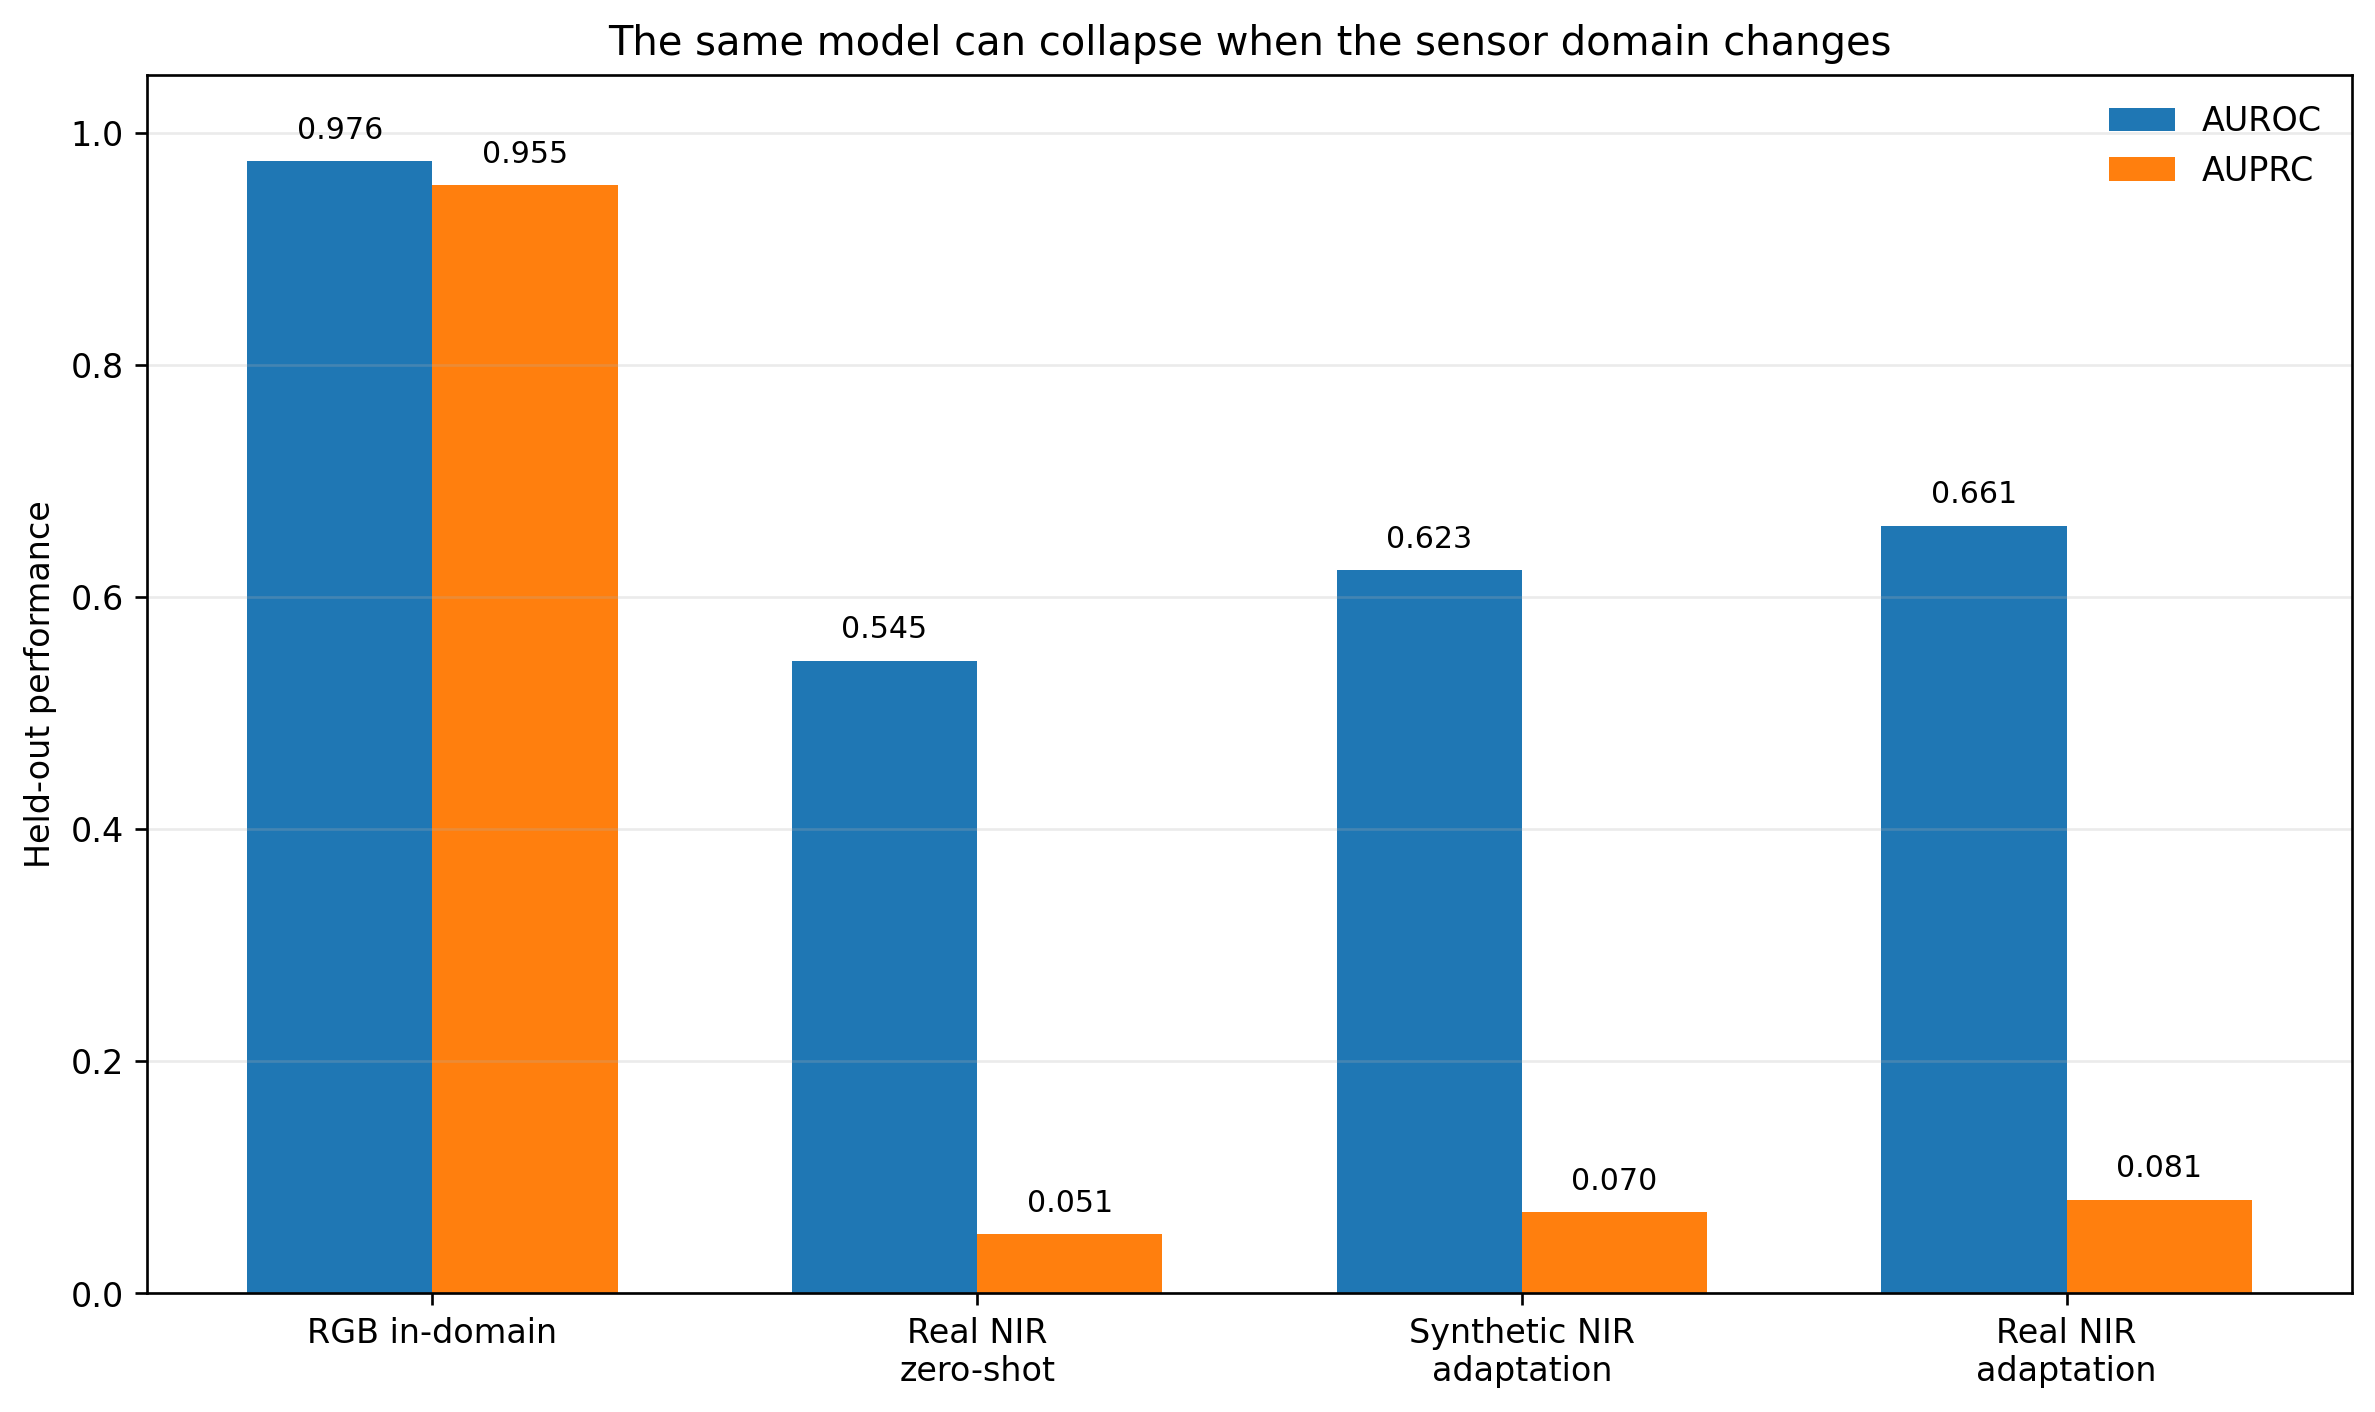
The cheap synthetic augmentation recovered a meaningful part of the damage caused by changing the sensor domain, but genuine sensor examples still contained information that our visual imitation did not. That creates an advantage for a company operating a camera network every day. Deployments can expose strange reflections, unusual windscreens, odd hand positions, rare vehicle interiors, difficult clothing, hard negatives and new camera conditions. Human review can identify examples the model scored with high confidence but got wrong, creating valuable evidence of where it fails.
A billion vehicles may matter more than a cleverer neural network
The size and specificity of an enforcement dataset should therefore be treated as part of the technology itself. Consider two organisations using broadly similar architectures. One trains on generic images of distracted drivers, while the other repeatedly sees images captured by the exact cameras, optics, illumination, viewpoints and road environments its deployed system will encounter. Over time, they are no longer solving the same problem in machine learning. One owns a model, while the other owns an increasingly detailed map of where that model fails.
Our experiments give us a small version of that process. More data relevant to the deployment domain improved the same architecture, and concentrating further learning on difficult examples improved it again. Changing the sensor distribution broke its performance. Synthetic adaptation repaired part of the damage, while genuine data from the sensor domain repaired more. None of those steps required a revolutionary new architecture. Policymakers should consider what they are actually procuring when they buy an AI system, including the data and processes that support its performance.
Confidence is not evidence
After NIR adaptation, the system’s ranking ability improved substantially, but its raw confidence scores were poor. Ranking asks whether images showing phone use receive higher scores than images that do not. Calibration asks whether the probabilities match observed frequencies, for example, whether about 80% of images assigned an 80% probability of phone use actually show it. These are different properties, and a useful ranking alone does not establish a trustworthy probability.[14]
ECE stands for Expected Calibration Error. It groups similar probability estimates, compares the average predicted probability with the observed frequency of the corresponding outcome, and averages the absolute gaps, giving more weight to groups with more examples. In plain English, it measures how far the model’s stated confidence is from what happened in those groups. Zero means no gap between the averages in those groups. Lower is better, but the result depends on how the groups are chosen and how much data they contain. A low average can still hide errors within a group.[14]
The Brier score measures the average squared difference between a predicted probability and the actual outcome, recorded as 1 for phone use and 0 otherwise. If the model predicts a 90% probability and phone use is present, the difference is 0.1 and its squared error is 0.01. If phone use is absent, the difference is 0.9 and the squared error is 0.81. In plain English, confident predictions that turn out to be wrong incur larger errors. Lower is better, with zero representing perfect probability predictions on the evaluated cases.[15]
Log loss evaluates the probability the model assigned to the outcome that actually occurred. It calculates the negative logarithm of that probability and averages it across the cases. In plain English, giving a high probability to the outcome that happened produces a smaller error, while giving it a very low probability produces a much larger error. It penalises confident mistakes especially heavily, so a model that is almost certain about the wrong answer pays a large penalty. Lower is better.[15]
On pooled predictions for drivers held out from training and adaptation, our adapted NIR model had an ECE of roughly 0.392. We fitted a simple calibration model using only validation drivers and applied it unchanged to unseen test drivers. ECE fell to 0.0047, reducing the average gap from about 39.2 percentage points to 0.47 percentage points. The Brier score and log loss also improved, with the Brier score falling from 0.245 to 0.038 and log loss falling from 0.716 to 0.163.
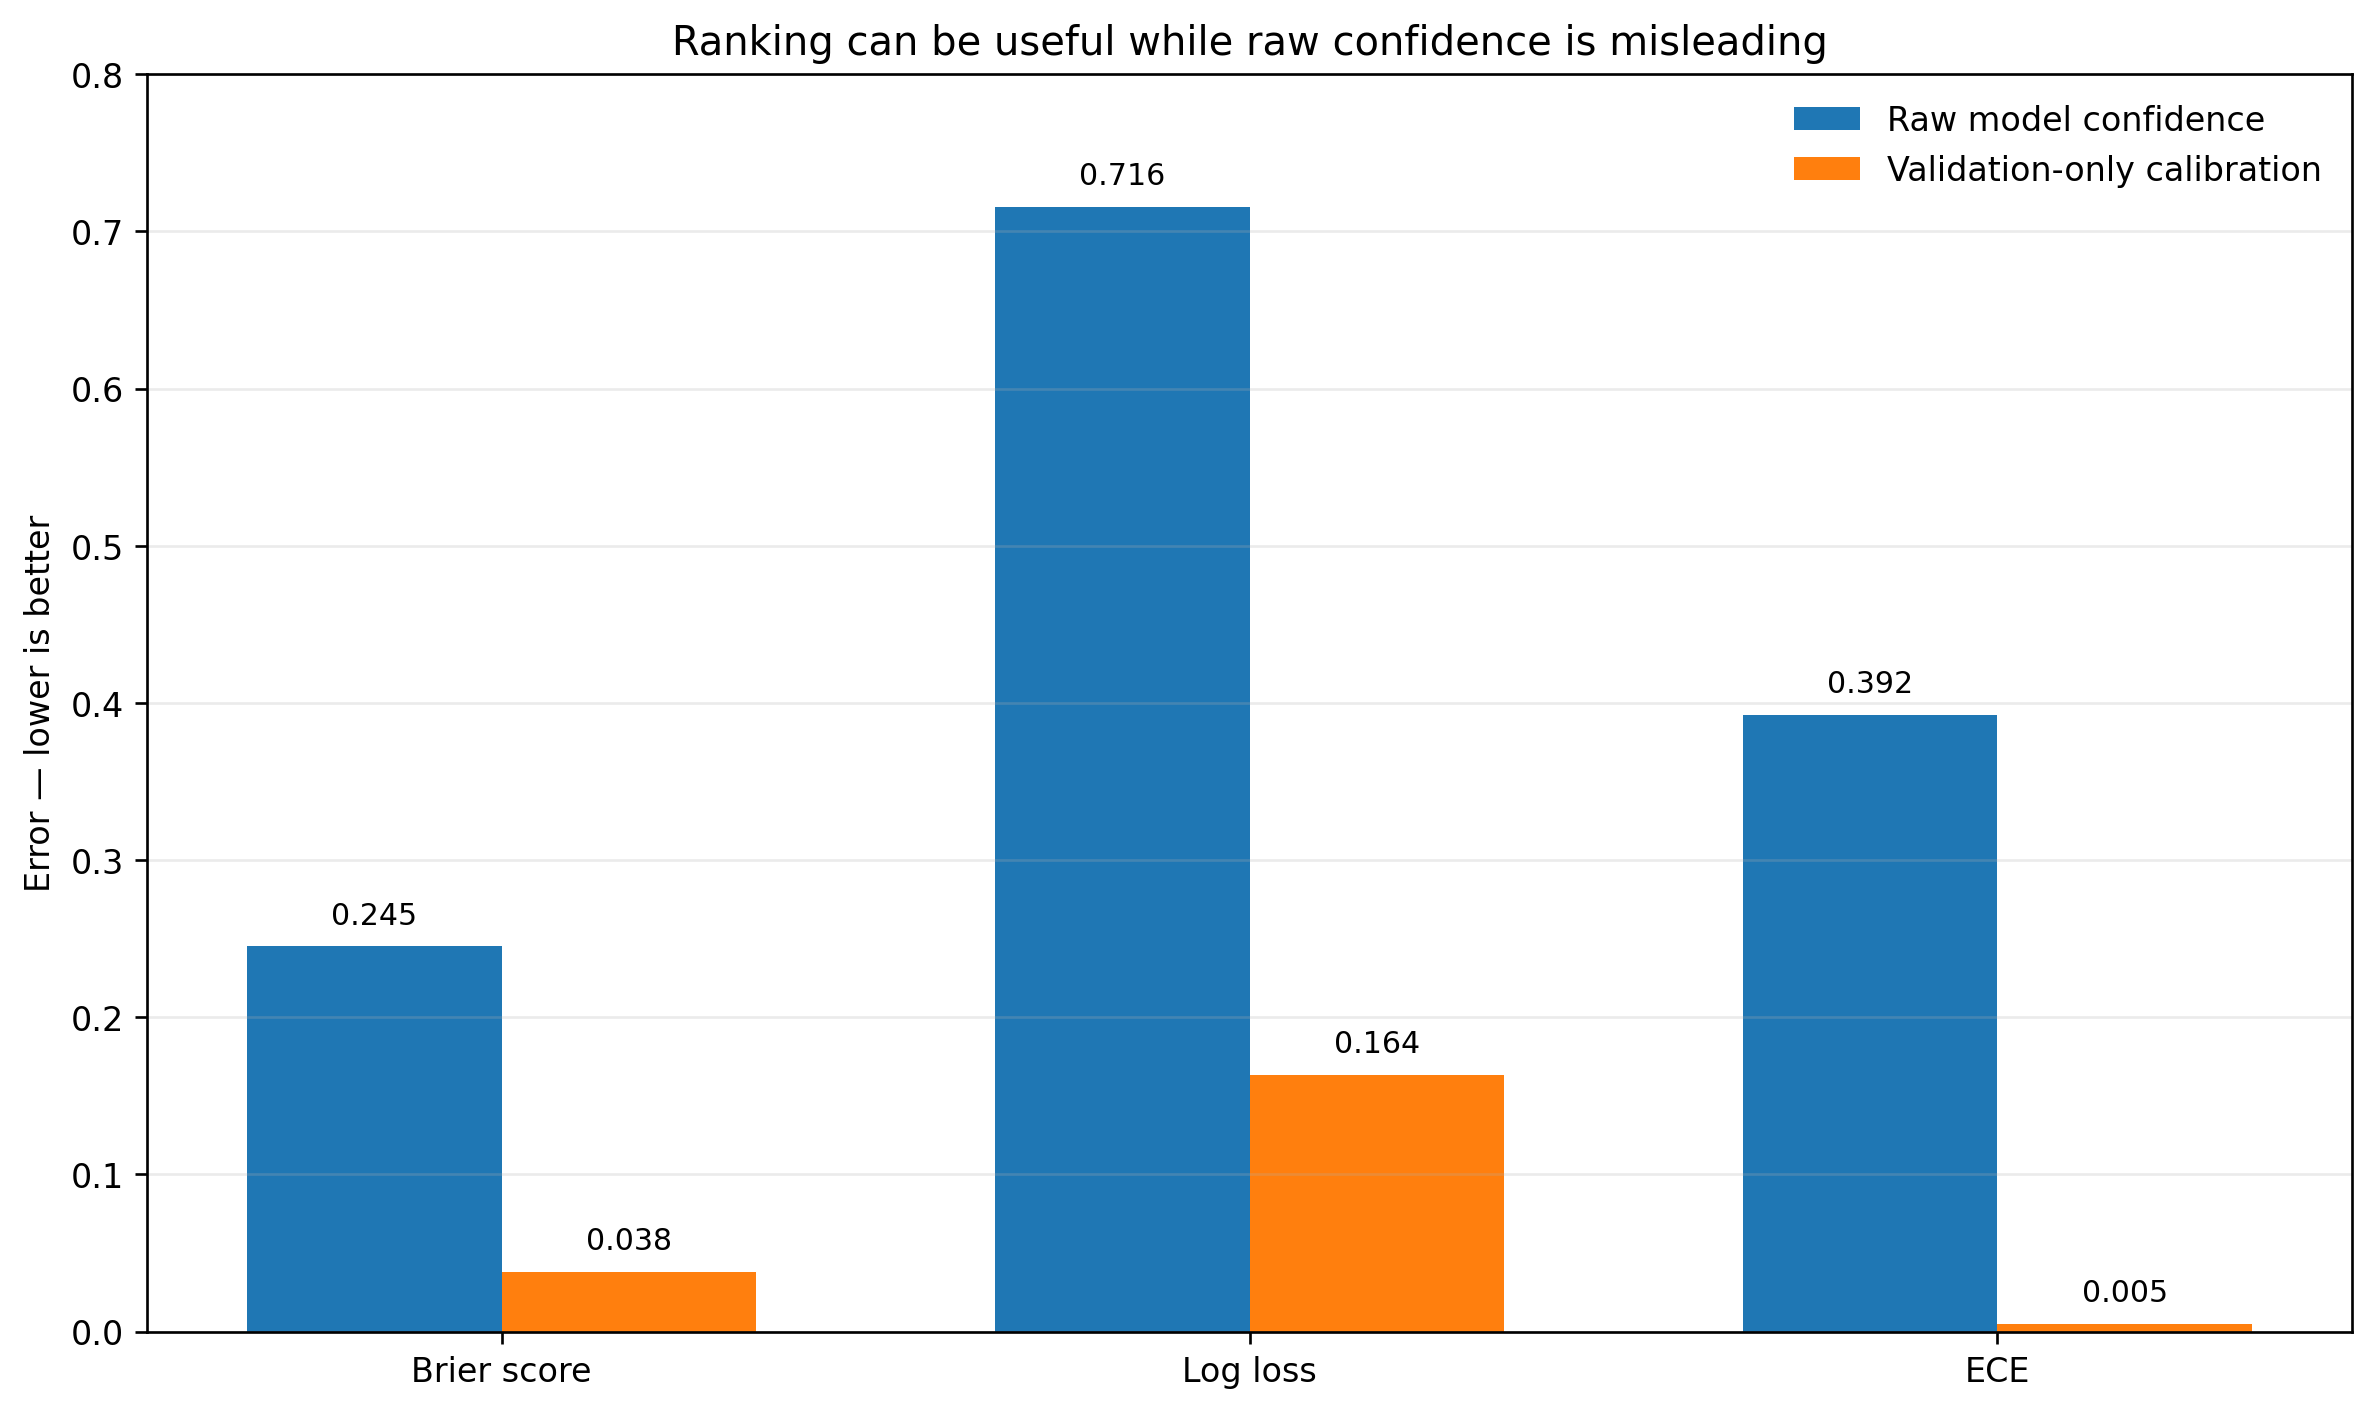
The ranking within each evaluation fold did not change, only the interpretation of the confidence did. ECE describes agreement within probability groups, while Brier score and log loss assess overall probability quality, including whether predictions match the outcomes. These averages need to be read alongside the test conditions and the model’s ranking performance.[14][15]
That distinction matters when a confidence threshold determines which members of the public enter an enforcement workflow. Authorities need evidence that the scores used to control referrals have an empirical meaning under the conditions where the system operates.
“A human checks it” is necessary. It is not the whole answer.
Acusensus describes meaningful safeguards in its UK process. Only images flagged by AI are initially seen by a human, with the first reviewer receiving a cropped region around the suspected violation. A second reviewer independently checks potential offences before progression. The company also says its roadside AI is not continuously learning from passing traffic and does not use facial recognition. Those are important design choices.[2]
Human review still leaves the preceding algorithm in control of which images receive attention. Imagine a system examining one million vehicles and selecting 5,000 images for human inspection. Reviewers can reject false positives among those 5,000, but they cannot identify an offence in an image they were never shown. The algorithm controls the funnel into the review process.
The public therefore needs answers to two questions: how often do human reviewers reject AI referrals? And how often does the AI fail to refer something a human would consider an offence? Answering the second requires auditing some images the AI did not flag. Without that check, a system can appear extremely precise while its recall remains largely invisible.
Government already understands that technical systems can fail quietly
Britain's road enforcement infrastructure provides an instructive comparison. In January 2026, the government published terms for an independent review after National Highways identified a technical anomaly affecting the interaction between some HADECS speed cameras and variable speed limit signs. The problem was a timing issue between components of a larger enforcement system, rather than an AI hallucination. In those review terms, National Highways reported approximately 2,650 erroneous activations dating back to 2021. These activations did not all result in enforced cases.[6]
The episode demonstrates an important principle: trustworthiness belongs to the whole evidential system, not just the classifier. The camera, sensor, timing, lighting, software, model and referral threshold all matter, as do the human reviewer, evidence package, update procedure and appeal process. Any one of those components can become the weak link, even when the other parts appear to be working well.
The government's own AI rules already point in this direction
The UK's Algorithmic Transparency Recording Standard exists to make the use of algorithms in the public sector more visible. Government guidance says it is mandatory for central government organisations in scope when algorithmic tools have a significant influence on decisions with public effect. That definition explicitly includes tools performing a triaging or scoring function within a larger process of making decisions.[7]
Police forces sit in a different part of the transparency framework. The current mandatory ATRS scope is centred on central government, while other organisations in the public sector, including police, are encouraged to publish records voluntarily. That distinction matters when describing what the standard currently requires.[8]
The principle should extend beyond that administrative boundary. An AI system does not need to issue the final fine itself to be consequential. If it scores citizens and determines which cases humans investigate, it influences the process. If government believes algorithmic triage affecting the public warrants transparency, road enforcement should be one of the clearest places to demonstrate what meaningful transparency looks like.
So what should government require?
Our conclusion is not that AI cameras should be banned, and our experiments have not shown that Acusensus's production system is unreliable. We have never tested its proprietary production model. Our reconstruction cannot reproduce its exact hardware, training corpus, operational calibration or years of deployment data. That limitation is fundamental, but our experiments show why accepting a single headline accuracy figure would be nowhere near sufficient.
For an AI system participating in an evidential process, authorities should be able to demonstrate the following requirements. These do not require a company to reveal its source code or trade secrets. They require evidence about performance in the conditions of deployment, the operation of the review process and the ability to identify and challenge mistakes.
Validation in the deployment domain. Performance should be measured on imagery matching the actual cameras, illumination, roads, vehicles and jurisdictions where the system is deployed.
Testing for changes in operating conditions. Authorities should know what happens to performance when lighting, optics, weather, vehicle interiors or deployment geometry change.
Calibration. If confidence scores control referral thresholds, those scores should have a demonstrated empirical meaning on deployment data withheld from training.
Performance within the review budget. Authorities should report how many genuine offences are recovered when humans inspect the 1%, 5%, 10% or 20% of images with the highest scores, rather than relying solely on overall classification accuracy.
Human rejection rates. Authorities should report how often human reviewers disagree with the machine and reject its referrals.
Negative auditing. Authorities should randomly sample images the AI rejected, because false negatives otherwise remain largely invisible.
Monitoring model changes. A new model version should trigger renewed validation rather than inheriting the credibility of the previous system.
Independent challenge testing. Researchers or auditors should be able to probe realistic edge cases without needing access to proprietary source code.
Clear routes to contest outcomes. People affected by enforcement assisted by algorithms should be able to understand what evidence exists and challenge mistakes.
The real question
The debate around government AI often gets stuck between two caricatures: an infallible machine eliminating human error, or an autonomous surveillance state issuing fines without human involvement. Real systems are hybrids. Sensors constrain the world the model sees, models assign scores, thresholds determine what receives attention and humans review a filtered subset before acting within a legal process.
That complexity is precisely why trust cannot be reduced to “Don't worry, a person checks it.” or “The model is 99% accurate.” Neither statement explains the performance of the whole process or the conditions under which it has been evaluated. The public should ask a simpler question:
What has the government actually measured that gives it the right to trust this system?
AI can be extraordinarily useful in road safety. Our reconstruction shows how capable even a comparatively conventional vision pipeline can become when the acquisition system is controlled and the data closely matches deployment. It also shows how abruptly that competence can disappear when the world changes. That is the lesson policymakers should remember. When an algorithm helps decide which citizens become subjects of enforcement, trust should never be assumed from the sophistication of the technology. It should be demonstrated by evidence.